
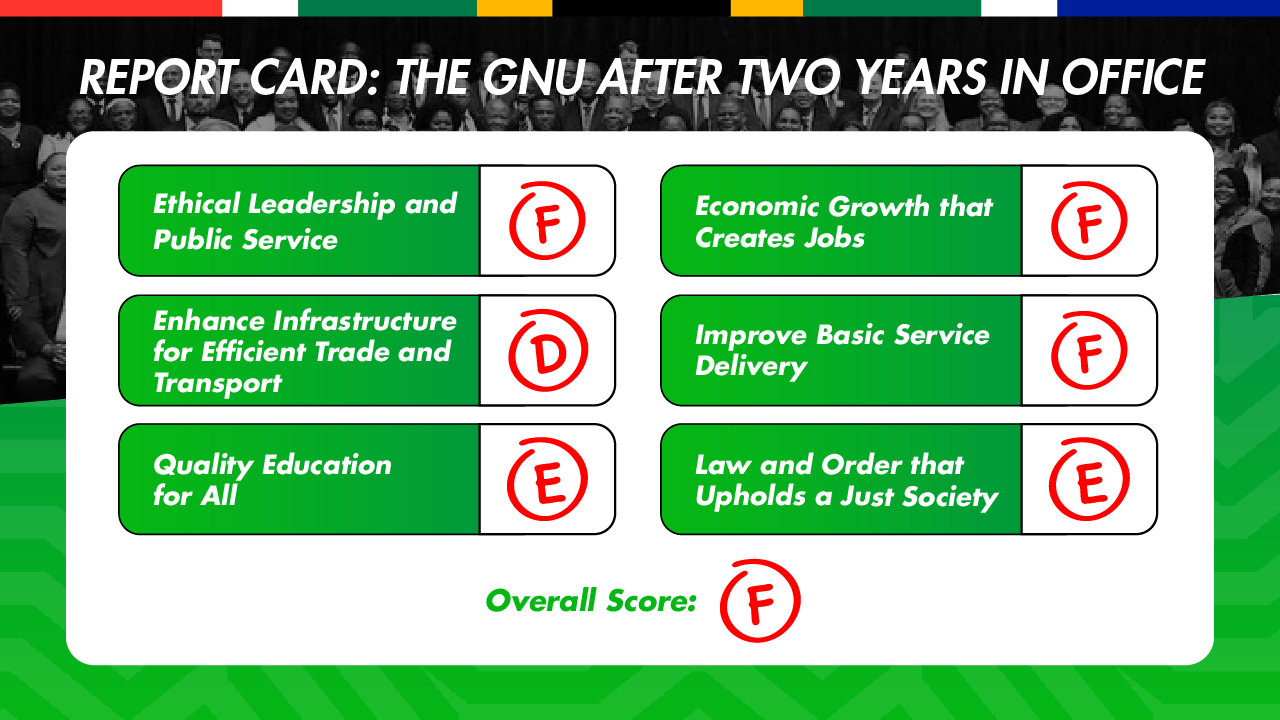
Welcome to ActionSA’s GNU Performance Tracker, a comprehensive index designed to monitor and hold accountable South Africa’s Government of National Unity (GNU). The tracker is aligned with ActionSA’s core values and vision for an inclusive, prosperous, and secure nation.
Each metric in the tracker is measured against a predetermined ActionSA benchmark, informed by government targets, international best practice, and ActionSA policy recommendations. The tracker will be updated regularly, empowering citizens to see where their government is succeeding and where it is falling short.
Explore the Tracker

The GNU expanded the cabinet from 30 to 32 Ministers and from 36 to 43 Deputy Ministers. These new positions increase the cabinet’s annual budget by R239 million, placing an excessive burden on already overburdened taxpayers.
ActionSA’s solution: A lean, effective cabinet of no more than 20 Ministers, with all Deputy Minister positions abolished and ministerial perks drastically curtailed.

While these expenditures are officially justified, they constitute lavish use of taxpayer funds at a time when millions of South Africans are unemployed and essential services are underfunded.

Sources: Parliamentary question replies, National Budget, Ministerial Handbook

The GNU has committed to pursuing rapid, inclusive and sustainable economic growth. By tracking the annual GDP growth rate, we can evaluate the government’s economic reforms, fiscal strategy, and infrastructure investment. To bring South Africa in line with developing country and Sub-Saharan African peers, ActionSA demands as our minimum benchmark annual GDP growth of 3%, while 4% will be deemed good, and 5% excellent, by 2029.
Data Source: StatsSA
Since 1994, South Africa has consistently faced one of the highest unemployment rates in the world, making job creation a critical priority for the current government. ActionSA uses the expanded unemployment rate—which includes discouraged job seekers—to measure progress on this front. We challenge the government to reduce this rate to below 30%, a benchmark last achieved in 2008 during South Africa’s most successful period of job creation.
Data Source: StatsSA
Rising food prices hit the poorest households the hardest. Tracking annual inflation in food and non-alcoholic beverages helps gauge whether government policies are protecting the livelihoods of all South Africans. Now that National Treasury has formally adopted a 3% inflation target, ActionSA believes food inflation must also be brought below this threshold — and kept there consistently — to prevent further erosion of household purchasing power.
Source: StatsSA

By tracking how many cents of every Rand collected as tax revenue is paid as interest on outstanding debt, ActionSA can monitor the government’s ability to borrow responsibly and invest wisely. To ensure that government funds are spent on crucial service delivery, and to bring South Africa in line with emerging market peers, ActionSA believes that debt service costs should not be more than 10 cents per Rand of revenue.
Data Source: SARB, National Treasury
Global competitiveness measures South Africa’s ability to provide a conducive environment for businesses to thrive, attract local and foreign investment, and foster innovation. The International Institute for Management Development (IMD) assesses countries’ performance across key areas such as infrastructure, government efficiency, business dynamism, and labour market conditions. ActionSA maintains that South Africa should at the very least be the most competitive country in Africa, and ideally in the global top 50.
Data Source: IMD

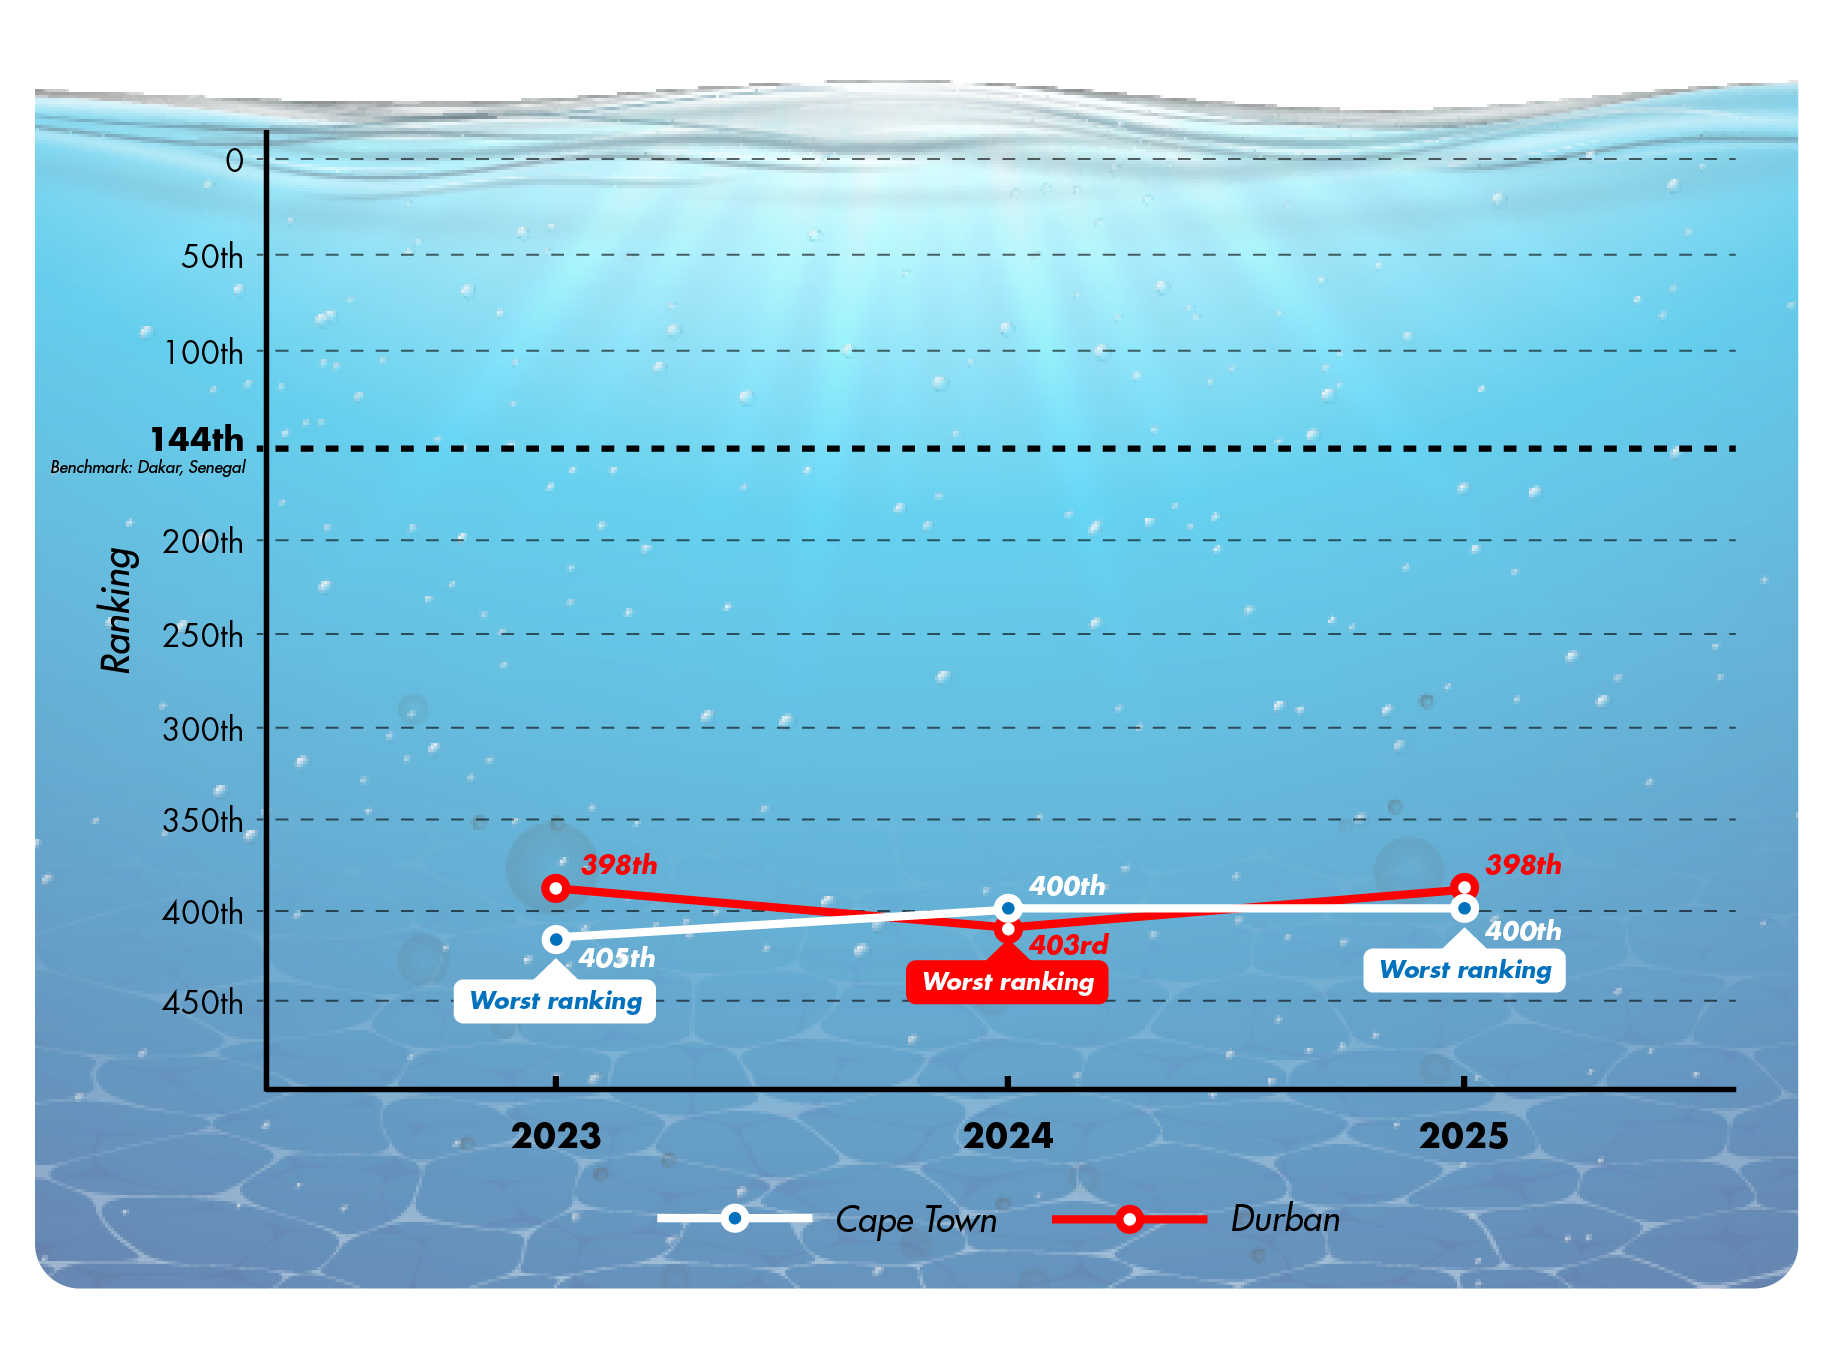
Efficient ports are critical to trade, which directly impacts economic growth. The World Bank Global Container Port Performance Index measures the operational efficiency of container ports worldwide by evaluating factors such as the time vessels spend in ports and how quickly containers are processed. Tracking the performance of Cape Town and Durban harbours reflects how well the government is managing key logistics infrastructure. ActionSA believes that South Africa’s ports should be at least the highest-ranking ones in Sub-Saharan Africa.
Data Source: World Bank

Eskom Performance tracks the Energy Availability Factor (EAF) — the percentage of Eskom’s generation capacity that is available to produce electricity at any given time. As Eskom’s main operational benchmark, EAF is the most direct indicator of how well South Africa’s electricity infrastructure is maintained and managed. A higher EAF means fewer breakdowns and a more stable electricity supply for households, businesses, and industry. The Minister of Electricity and Energy has identified a 70% EAF as the minimum threshold required to eliminate loadshedding. ActionSA believes that performance against this benchmark is essential to evaluate whether the GNU is delivering the operational improvements needed to end South Africa’s energy crisis.
Data Source: StatsSA


Access to proper sanitation is a basic human right and a cornerstone of public health and dignity. This metric measures the percentage of households without access to basic and safe sanitation, serving as a direct indicator of how well the government is addressing the needs of the most vulnerable in society. It also reflects progress in eliminating reliance on unsafe systems like bucket toilets, while highlighting broader improvements in service delivery and infrastructure. The benchmark for this metric is 0%, in line with South Africa’s National Development Plan (NDP) goal of achieving universal access to proper sanitation by 2030.
Data Source: StatsSA

The “real” matric pass rate tracks the percentage of learners who complete Grade 12 relative to the cohort that initially entered Grade 10. Unlike the official matric pass rate, which only reflects the learners who sit for and pass the exams, this metric offers a clearer view of education outcomes by factoring in those who drop out. ActionSA’s benchmark is a 75% completion rate, aligning with NDP education goals.
Data Source: NSC Examination Reports, Basic Education School Realities Reports
The student support metric tracks the number of students funded by the National Student Financial Aid Scheme (NSFAS). This metric is crucial for assessing the government’s commitment to expanding access to higher education, particularly for students from low-income backgrounds. ActionSA believes that NSFAS must support at least one million students each year to fulfil its mandate of promoting equity and opportunity.
Data Source: NSFAS Annual reports
This metric tracks the number of murders committed daily, offering insight into the government’s performance in combating violent crime and the effectiveness of law enforcement measures aimed at reducing murder rates. Recognising the challenge of combatting this social ill, ActionSA challenges the government to commit to halving the murder rate by 2029, targeting less than 38 murders per day by that year.
Data Source: SAPS
This metric tracks reported sexual offences, including rape, per day. It is essential for evaluating efforts to address gender-based violence and improve safety for vulnerable populations. Recognising the challenge of combatting this social ill, ActionSA challenges the government to commit to halving the sexual offences rate by 2029, targeting less than 75 reported offences per day by that year.
Data Source: SAPS
The unchecked movement of undocumented individuals across borders complicates effective service delivery, particularly in communities already struggling with inadequate infrastructure and high unemployment. This metric tracks the total annual cost of deporting undocumented foreign nationals and illegal immigrants. By investing in secure and efficient border management systems, the country can reduce the influx of undocumented individuals, thereby decreasing the cost of deportations. These savings can then be redirected toward initiatives that restore the dignity of South African citizens, such as improving access to housing, education, and healthcare services.
Data Source: Parliamentary replies